LCS Winter 2015 Split has just finished for League of Legends and it’s time to start crunching some numbers to see how these top ranked players compare to one-another. Several Disclaimers: This post is a big graph heavy, but I’ll try and explain each of them as much as possible; there might actually be some code that some of you might want to skim over; all data was gathered from the Fantasy LCS view that is given for Stat tracking, so data might not be as granular as I’d like and not many features to compare against.
Stats given from Fantasy LCS
- Average Points per Game (AP)
- Total Points for the Split (TP)
- Kills (KI)
- Deaths (DE)
- Assist (AS)
- Creep Score (SC)
- +10 K/A (KA)
- Multi-Kills (not used)
Omitted Stats:
- Players who didn’t play the majority of the Split were omitted from analysis, 12/18 Games Minimum
What is Considered the Best for Each Lane?
Each lane has a different role for the team so the average stats for that role are going to be different based upon what role you’re looking at. If you aren’t familiar with League of Legends, then the roles are AD Carry, Mid, Top, Jungler and Support. The first two heavily emphasize kills, both in killing other players (KI) and killing enemy NPCs (CS) that spawn periodically in each of the lanes (Top, Mid, Bottom). So for the ADC and the Mid lane roles, good players will have relatively higher KI and CS than players not as adept to the role, and much higher than players filling other roles such as Support who will be racking up assist (AS) points instead.
While all of the different roles will have varying Stats, it’s hard to determine which are those that will matter the most for each role. So instead, I tried grouping players together. Which are the players in each role that are similar to other in plays. Using a K-means approach, we can cluster similar players together.
Aside: K-Means
The idea behind K-Means is somewhat simple. For a 2-dimensional space and we specify the predicted number of clusters, find the clusters that best represent each “type” of data that is present.
What is going on in the gif is that at first, we give random points as to start the search with a predicted number of clusters to be three. Each step, we group points to their closest cluster-point, move the cluster-point closer its grouping, and repeat until cluster-points don’t move anymore. This way, the cluster point becomes the centroid of each grouping. This is useful because any new point that comes in only needs to find its closest cluster-point and it automatically knows which group it will be in.
In terms of LCS:
With respect to the LCS stats, we run K-Means on a pair of player stats and determine which players should be grouped together by their stat similarities.
The points that were used for each role were:
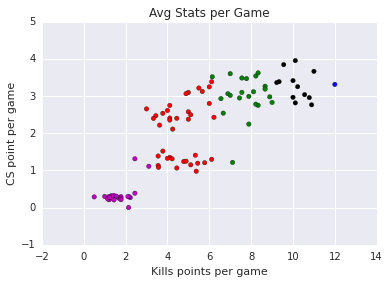
Top, ADC, Mid: Kills (KI) vs CS (CS)
Jungle, Support: Assists (AS) vs +10 K/A (KA)
Each color represents a different grouping (category) for the players. Each color means something different for each graph but they always represent grouped players, which I setup a predicted 5 categories for the players.
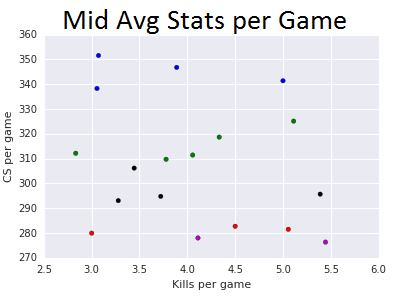
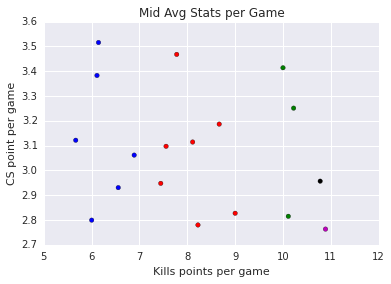
| Mids | Kills and CS / Game |
| BLUE GROUP: | Fox, Ryu |
| RED GROUP: | Link,PowerOfEvil, Hai |
| GREEN GROUP: | Febiven, Pobelter, Keane, Shiphtur |
| BLACK GROUP: | Bjergsen, Froggen, Slooshi8, Nukeduck, PepiiNeRO |
| MAGENTA GROUP: | Soren, |
Looking at the Mid group, it tried to group players with relatively high CS as being similar vs the avg kills per game. This is partly due to the K-Means minimizing the distance between each group, and the number of CS is drastically higher than number of kills per game, so it would require a renormalizing of the data to be within similar ranges to get a better grouping.
Which means that we’ll need to actually normalize them somehow. In this case, we’re going to start grouping players by the LCS Fantasy points that they generate on each stat.
Top
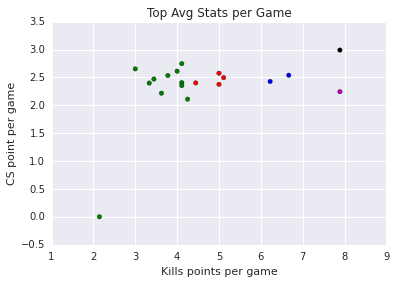
| Top | Kills and CS / game |
| BLUE GROUP: | Vizicsacsi CaliTrlolz8 |
| RED GROUP: | Impact Hauntzer Odoamne Quas |
| GREEN GROUP: | fredy122 ZionSpartan YoungBuck Avalon BallsDyrusOverpowWickdGamsuWerlybCris |
| BLACK GROUP: | Cabochard |
| MAGENTA GROUP: | Huni |
Support
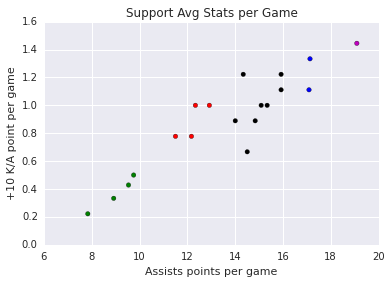
| Support | Assists and KA / Game |
| BLUE GROUP: | LustboyGleeb |
| RED GROUP: | LemonNationXpecialDodo8 VandeR |
| GREEN GROUP: | Sheep KiWiKiD Nisbeth Rydle |
| BLACK GROUP: | nRatedEDwardAphromoo kaSing Bunny FuFuu Unlimited Hylissang Adrian |
| MAGENTA GROUP: | YellOwStaR |
Mid
| Mid | Kills and CS / game |
| BLUE GROUP: | Keane Fenix Hai Nukeduck Kori Shiphtur |
| RED GROUP: | Froggen PowerOfEvil Pobelter XiaoWeiXiao Slooshi8 Ryu PepiiNeRO |
| GREEN GROUP: | Bjergsen Soren Link |
| BLACK GROUP: | Febiven |
| MAGENTA GROUP: | Fox |
Jungler
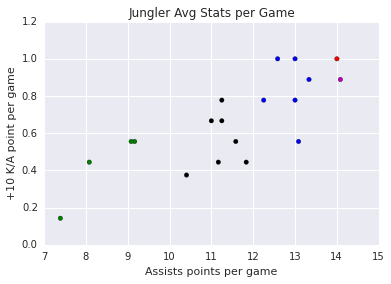
| Jungle | Assists and KA / game |
| BLUE GROUP: | Reignover Diamond Kikis Rush Airwaks Saintvicious |
| RED GROUP: | Svenskeren |
| GREEN GROUP: | Jankos H0R0 ImpalerFr3deric |
| BLACK GROUP: | Porpoise8 Loulex Meteos Xmithie Helios IWDominate Shook |
| MAGENTA GROUP: | Santorin |
AD Carry
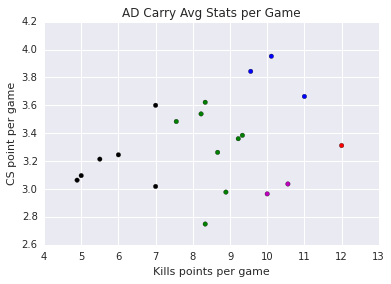
| ADC | Kills and CS / game |
| BLUE GROUP: | Freeze FORG1VENGRE Cop |
| RED GROUP: | WildTurtle |
| GREEN GROUP: | P1noy Hjarnan Doublelift Altec Sneaky Vardags Rekkles Woolite |
| BLACK GROUP: | MrRalleZ maplestreet8 CoreJJ Piglet Adryh Mash |
| MAGENTA GROUP: | SteeelbackApollo |
But the point of the matter is that given just a random pairing on stats, it doesn’t help determine what stats make up a player in that role, but only gives us the similarities of players within the stats being compared. We could expand K-means to run against all of the features KI-KA and group player with each other, but this it already being 7 stats represent meaning a 7-dimensional group, that would be bit hard to visualize. So, let’s start reducing which stats actually make up a player for each role.
Let the Machine Find What is the Best Players are in Each Lane?
To get the machine to find out a role’s stereotype, you just need to give it the stats of a players in that role and it tried to group them for you. To do this, we a player’s behavior compared to the average player in that role and see how much they detract from that average. Better yet, we do that for all of the stats and see which stats are significant to determining a players grouping.
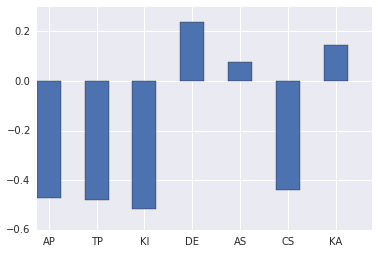
Not getting into the math of it, we find the eigenvalues from the standardized data (difference from the average) and using SVD decomposition (a way of reducing a many-dimensional set of data to a lower-dimensional set of data, in this case 7-dimensional to 1 dimensional) With this data, we can see what the “stereotypical” player profile is.
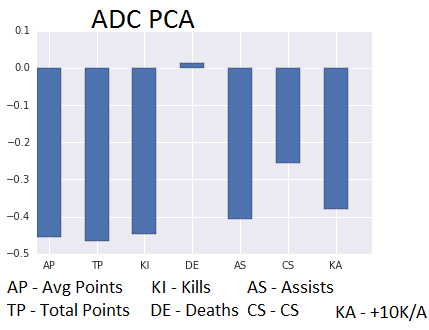


Looking at almost every graph, all of the players correlate well to in Deaths, with Mid dying a particularly high amount of the time and ADC trying to have the least correlation to death than others. But most players are bad at everything else, getting kills, assists, CS from one another. This kind of makes sense for a game like League of Legends where one-side typically dominates another side, so only one side will have a high kill-count (KI) instead of both ADCs having high kill-counts (KI) per game. The only exception is that Top has a higher +10K/A (KA) correlation than other lanes partly due to their inactivity in team fights, being initiators and typically tanky characters all-around that they are in many of the fights throughout the game.
So using this grouping based on all of the stats, we can finally visualize what players are relatively similar to one another.
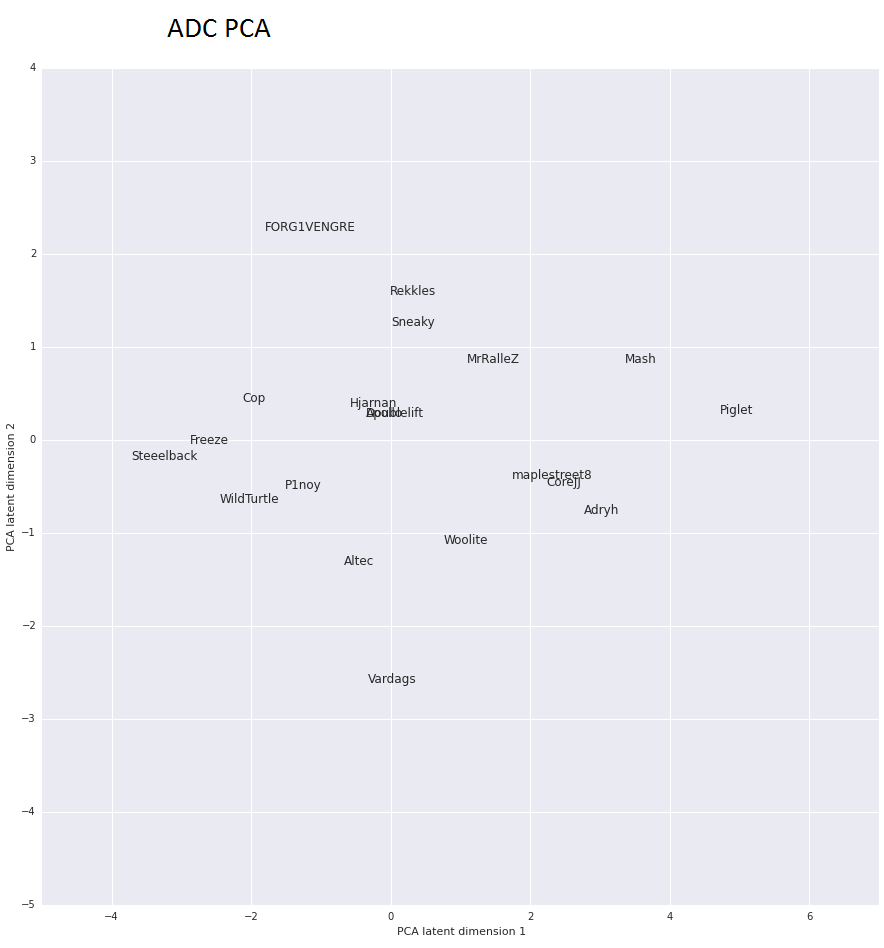
In the PCA graph for ADCs, we can see which players are similar and the direction that a player takes when they are better than others. Hjarman, Doublelift and Apollo have have similar stats
| Name | Avg PTS per Game |
Total PTS |
K (+2) |
D (-0.5) |
A (+1.5) |
CS (+0.01) |
10+ K/A (+2) |
3K / 4K / 5K (+2 / +5 / +10) |
| Apollo | 20.13 | 362.37 | 90 | 30 | 92 | 5,337 | 2 | 1 / 0 / 0 |
| Hjarnan | 20.01 | 360.23 | 78 | 30 | 99 | 5,873 | 3 | 3 / 0 / 0 |
| Doublelift | 19.93 | 358.69 | 74 | 36 | 106 | 6,369 | 1 | 2 / 0 / 0 |
Point-wise, they are fairly similar, especially when looking at their avg and total points for the split (AP, TP)
And what’s also important is the trend that you can find for players who outperform others. In this case, they will be placed more to the left from everybody else.
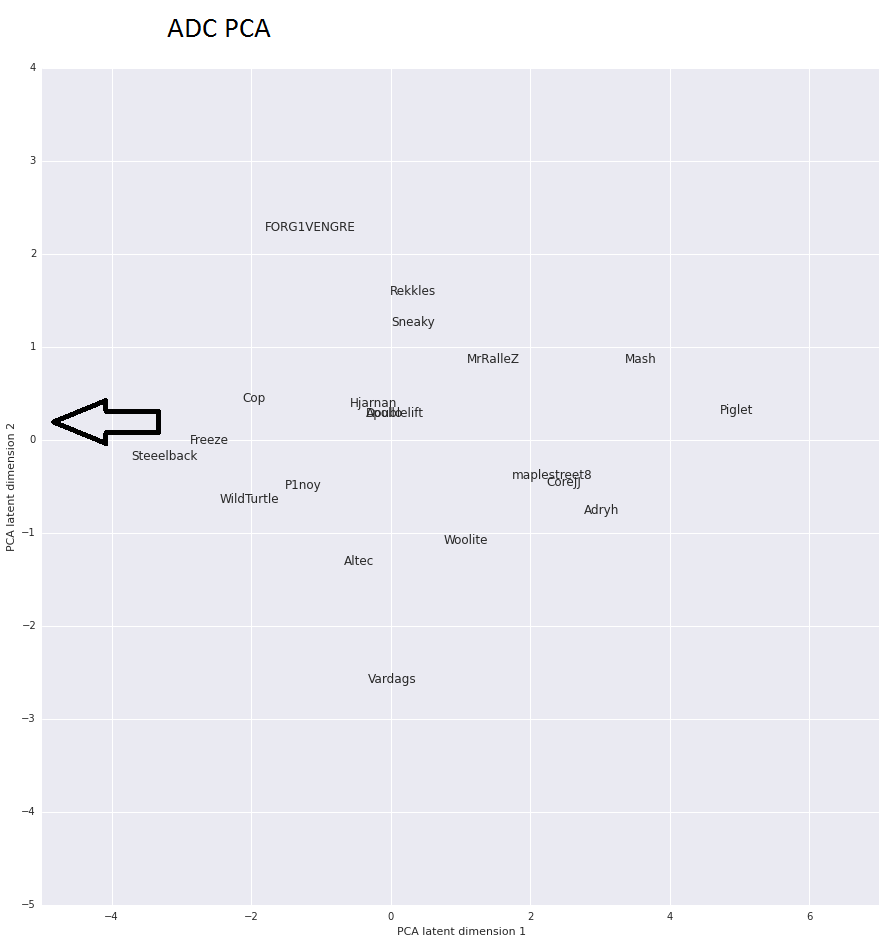
Steelback, Freeze, Wildturtle, Cop…
| Name | Avg PTS per Game |
Total PTS |
K (+2) |
D (-0.5) |
A (+1.5) |
CS (+0.01) |
10+ K/A (+2) |
3K / 4K / 5K (+2 / +5 / +10) |
| Steeelback | 25.84 | 465.15 | 95 | 27 | 144 | 5,465 | 6 | 3 / 0 / 0 |
| WildTurtle | 24.01 | 432.11 | 108 | 42 | 99 | 5,961 | 4 | 3 / 1 / 1 |
| Freeze | 23.15 | 416.63 | 91 | 38 | 109 | 7,113 | 6 | 1 / 1 / 0 |
| FORG1VENGRE | 22.68 | 408.18 | 86 | 16 | 110 | 6,918 | 2 | 3 / 0 / 0 |
| Cop | 21.91 | 394.44 | 99 | 32 | 85 | 6,594 | 6 | 1 / 1 / 0 |
Players that are more and more proficient the ADC role are trending to the left from the group and we can easily see why. These are the players dominating in an average game in either CS, Kills or other means and generating points for your Fantasy team.


What about for all the roles?
Not going into the details of everybody, I reran all of the same analysis without the role distinction so see how players stacked against one another.
K-Means
| All | Kills and CS / Game |
| BLUE GROUP: | WildTurtle |
| RED GROUP: | Svenskeren Santorin Diamond Impact Kikis fredy122 Hauntzer Vizicsacsi Rush Odoamne Airwaks Porpoise8 Fenix Hai ZionSpartan Loulex Meteos Nukeduck Xmithie Helios IWDominate YoungBuck Shook Jankos Quas H0R0 Avalon Balls Dyrus CoreJJ Piglet Overpow Adryh Mash Gamsu ImpalerWerlybCris |
| GREEN GROUP: | Huni Cabochard Reignover Hjarnan Doublelift Altec Froggen Vardags PowerOfEvil Rekkles Pobelter XiaoWeiXiao Slooshi8 Ryu Woolite Keane MrRalleZ maplestreet8 CaliTrlolz8 Kori PepiiNeRO Shiphtur |
| BLACK GROUP: | Steeelback Febiven Bjergsen Freeze FORG1VENGRE Fox Cop P1noy Soren Link Apollo Sneaky |
| MAGENTA GROUP: | YellOwStaR Lustboy Gleeb nRatedEDwardAphromoo kaSing Saintvicious BunnyFuFuuUnlimited Hylissang Adrian LemonNation Xpecial Dodo8 VandeRWickdFr3deric Sheep KiWiKiD Nisbeth Rydle |
PCA
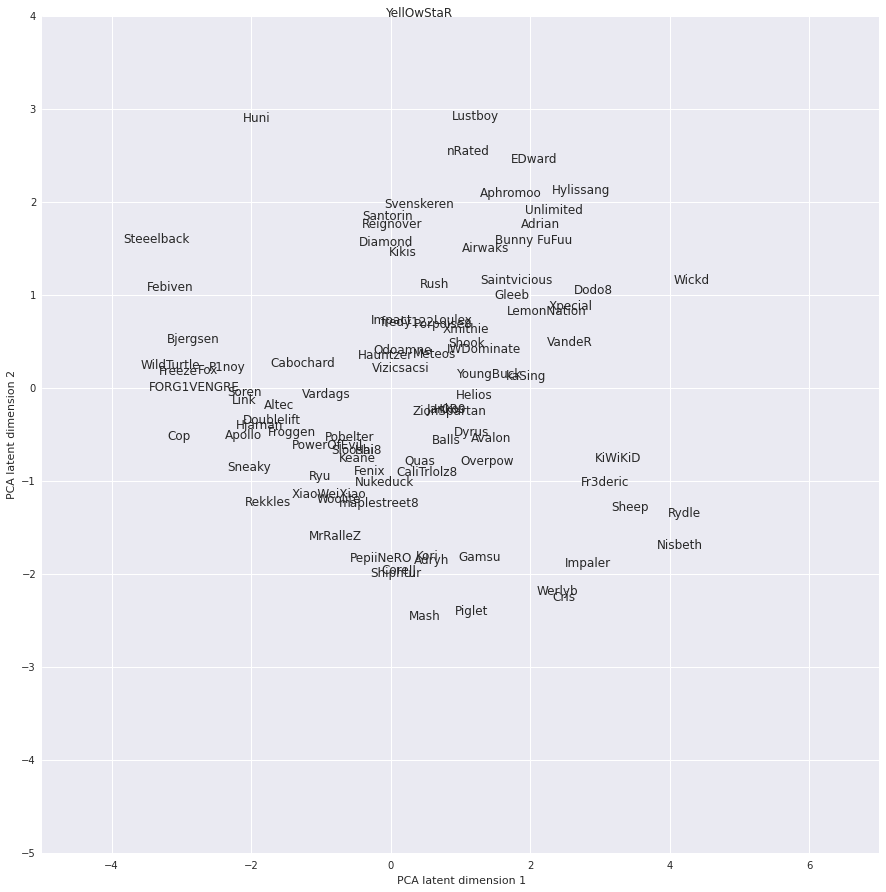
At a glance, ADCs are typically on the left, Supports are near the top, Jungler is mid-top just under the Supports, Tops are mid-left and Mids are mid to mid-left. What all of this means is that based on these stats on how a high-level player plays a role, ADCs and Mids stats are fairly similar as well as jungler/support’s stats.
I’m sure if I had a bit more granular data, like when kills happened by which role, when objectives were taken, etc… this data would look a bit more divisive for how roles interact with the game and how effective certain people are at each role, but that data I don’t have and for the moment, I’m probably not going to go rewatch all matches of Winter LCS to collect it.
Twitter: @GIntrospection

Leave a comment